Projects
Shore surface current - remote video-based measurement
Personal / Fluminance team, Inria Rennes, France, 2015-2017
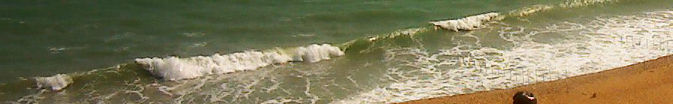

The Typhoon motion estimation algorithm retrieves sea surface current near the shore by remotely observing the displacement of the foam. Video data is provided by a basic video surveillance camera.
This work was achieved in collaboration with Rafael Almar from the LEGOS, Toulouse, France, who provided the video data and reference measures collected during the "2013 Grand Popo experiment"[1] in Benin.
Concept
In the surf zone, the foam is advected by the sea surface current. Motion estimation techniques enable to estimate the surface current by remotely observing the foam displacement throughout a video sequence. Such measures of the current are useful e.g. to swimming and surfing safety, coastal civil engineering or shore dynamics research.
Here, the main goal was to demonstrate the ability to perform decent measures from a video feed provided by a simple surveillance camera located on the beach (illustration below, scaled down to 25% of original size).
 To this end, images are first extracted from the video files, then rectified to correct for the perspective view, and filtered to enhance the foam patterns and reduce the visual influence of wave rollers.
The figure below shows a sample frame before and after rectification, as well as various areas of interest for the measures.
To this end, images are first extracted from the video files, then rectified to correct for the perspective view, and filtered to enhance the foam patterns and reduce the visual influence of wave rollers.
The figure below shows a sample frame before and after rectification, as well as various areas of interest for the measures.
 After these pre-processing steps, the Typhoon optical flow (OF) algorithm recovers the 2D surface current.
These video-based estimations are finally compared to independent measures provided by an acoustic Doppler velocimeter (ADV).
After these pre-processing steps, the Typhoon optical flow (OF) algorithm recovers the 2D surface current.
These video-based estimations are finally compared to independent measures provided by an acoustic Doppler velocimeter (ADV).
Results
Comparison of OF measures to that of the ADV proved somewhat difficult. The cross-shore velocity component evolves radically along the vertical direction, and the OF provides surface current whereas the ADV is located below the surface. Nevertheless, measures from these two sources are in remarkably good agreement on both rapid (2 s) and slower (2 min) time scales [2]. This study clearly highlights the potential of the method and, given the simplicity of the setup (a basic surveillance camera) and the limited spatial and temporal resolution of video data for this specific OF application, there is much room for improvement.
The video below shows an example of raw surface currents recovered by Typhoon (black vectors) superimposed on rectified input images. The orange vector is the ADV measure, and the teal circle is the area over which OF vectors are averaged to produce time-series. To the right are shown the time-series of velocity: cross-shore component u (top) and along-shore component v (bottom).
References and resources
- Almar, R., et al. The Grand Popo beach 2013 experiment, Benin, West Africa: from short timescale processes to their integrated impact over long-term coastal evolution. Journal of Coastal Research, 70(sp1), 651-656, 2014.
- Dérian, P and Almar, R. Wavelet-based Optical Flow Estimation of Instant Surface Currents from Shore-based and UAV Video. IEEE Transactions on Geosciences and Remote Sensing, accepted for publication, 2017.
- project repository on GitHub.
- Transient surf zone circulation induced by rhythmic swash zone at a reflective beach. Coastal Dynamics 2017, Helsingør, Danemark.
(more)
Hydrothermal vents - White smoker flow estimation
Personal / Fluminance team, Inria Rennes, France, 2017
"White smokers" are submarine hydrothermal vents. This project demonstrates the practical implementation of a basic video-based solution for the measurement of the flow out of the vent.
Concept
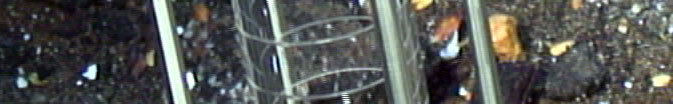
Videos of hydrothermal vents known as "white smokers" are captured from a submarine. The movies show a close view of the "FLO" instrument, a hot-film sensor measuring the fluid flow through a graduated cylinder. Small particles carried by the fluid are also visible. By tracking these particles in the video, it is possible to provide an alternative measure of the fluid velocity and thus estimate the flow.
Demonstrator
Particles are quite large and their density fairly low. This suggests a particle-tracking approach: individual particles are first detected in the region of interest (the cylinder), then each particle is tracked throughout the video sequence. The basic demonstrator simply tracks particles from one frame to the next, while a more advanced implementation would follow each particle from the time it appears in the cylinder until its exit for more robust measures.
 Particles are isolated by the "Running Gaussian average" background / foreground detection algorithm.
The displacement of each particle is estimated between two consecutive frames using a classical cross-correlation approach.
Finally, a quality control process flags and removes potential spurious estimates.
Particles are isolated by the "Running Gaussian average" background / foreground detection algorithm.
The displacement of each particle is estimated between two consecutive frames using a classical cross-correlation approach.
Finally, a quality control process flags and removes potential spurious estimates.

Resources
- whiteSmoker project repository on GitHub (Python).
- Deep-sea environment laboratory at Ifremer (FLO instrument).
- Philippe Rodier, Ifremer (video data).
(more)
Large-scale oceanic models under uncertainty
Fluminance team, Inria Rennes, France, 03/2016 - 08/2017
This post-doc position involved the exploration and numerical study of large-scale geophysical (oceanic) models under uncertainty. The flow velocity field incorporates random fluctuations.
Concept
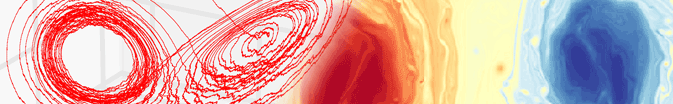
Larger scale oceanic models are derived following the "transport under location uncertainty" paradigm. [1] Several noise models were designed and implemented in the (stochastic) quasi-geostrophy model SQGMU [2] as well as in the NEMO ocean engine. Experiments also involved a stochastic version of the famous "Lorenz 63" model.[3]
Related works involved a collaboration with Shengze Cai for the design, development and testing of a fluid motion estimator built upon the same "transport under location uncertainty" paradigm.[4]
References and resources
- Mémin, E. Fluid flow dynamics under location uncertainty. Geophysical & Astrophysical Fluid Dynamics, 2014
- Resseguier V., Mémin E. and Chapron B. Geophysical flows under location uncertainty, Part II Quasi-geostrophy and efficient ensemble spreading. Geophysical & Astrophysical Fluid Dynamics, 2014
- Large scale flows under location uncertainty: a consistent stochastic framework. Quarterly Journal of the Royal Meteorological Society, 2017.
- Motion Estimation under Location Uncertainty for Turbulent Fluid Flow. Experiments in Fluids, 2018.
- SQGMU-2 project on GitHub.
- Docker-NEMO: Docker image to compile and run the NEMO ocean engine.
(more)
SAMPLE Winds II - SAMPLE and REAL lidar data analysis
Scientific consulting, 08/2015
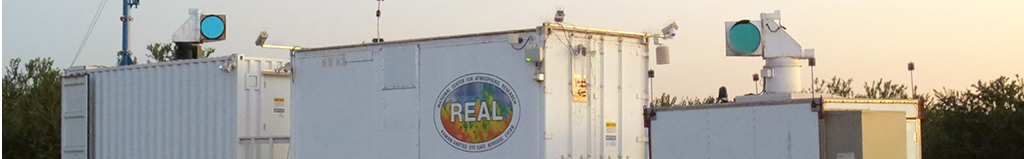
In the continuation of previous projects with the CSU, Chico and Spectral Sensor Solutions, LLC, this work performed the first direct comparison of aerosol backscatter data from SAMPLE and REAL lidars.
Two datasets of scans collected by the SAMPLE aerosol lidar were investigated, including a dataset collected in Chico, CA, alongside the REAL lidar.
The later data was used to perform the first direct comparisons of the two instruments,[1] including wind estimations[2].
 and SAMPLE (right) wind estimates.")
A tool was developed to detect aerosol plumes and export results as KMZ files for integration with Google Earth.

References
- Comparison of aerosol backscatter and wind field estimates from the REAL and the SAMPLE, SPIE Optical Engineering + Applications, 2015.
- Two-component wind fields from single scanning aerosol lidar, SPIE Optical Engineering + Applications, 2015.
- Real-time 2D wind estimation from aerosol lidar imagery.
- SAMPLE Winds I (previous project with S3).
(more)
Post-process camera stabilization
Personal, 04/2015
This small personal project explores motion compensation techniques to reduce wind-induced camera motion.
This project started with a friend who also faced wind-induced motion in some of his images sequences. While many solutions are readily available for motion compensation, we were curious to explore the underlying mechanisms by ourselves.
Our current implementation (Python) uses correlation-based techniques to identify correspondences within an image pair. These approaches are closely related to some of the motion estimation techniques used for instance on the wind estimation project presented below. Then, the optimal homography matrix, which in this case describes the transformation between two consecutive images that is induced by camera motion, is estimated from the set of correspondences using the RANSAC algorithm.
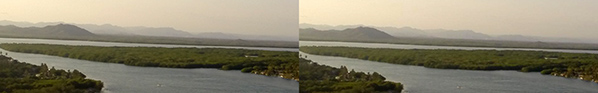
The video below shows a comparison of the original sequence (left) and the stabilized sequence (right). The stabilization is not perfect, yet the amplitude of camera motion is vastly reduced. The full-length, stabilized movie can be seen in the time-lapse section.
(more)
Real-time 2D wind estimation from aerosol lidar imagery
California State University, Chico, CA, 01/2013 - 12/2014
Computer vision methods are applied to lidar scans from the REAL, in order to recover the horizontal wind from the apparent motion of aerosols in the lower atmosphere.
Concept
This project uses the motion of aerosols in the lower atmosphere to infer the underlying horizontal wind field. It is an application of computer vision methods, somewhat similar to the well-known particle image velocimetry (PIV) used in the field of experimental fluid dynamics. Input images are aerosol backscatter data provided by the Raman-shifted Eye-safe Aerosol Lidar (REAL) located in Chico, California.
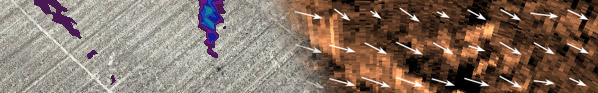
The apparent displacement of aerosol features between 2 consecutive scans of the REAL are extracted by motion estimation algorithms (illustration below).
This displacement field gives us an estimation of the instantaneous wind field.

In the video below, the background is the input backscatter data (copper colors). The estimated motion is visualized by tracers. This example shows the ability to recover a wide range of wind speeds, complex motions, as well as dynamic masking of unreliable estimates in the far range.
Chico 2013 experiment
The Chico 2013 experiment was designed to test the wind estimation in real-time, using two different motion estimation algorithms, and validate the results against a certified instrument.
Chris Mauzey and I designed and implemented the numerical framework that made this experiment possible.
It involved the retrieval and organization of raw backscatter data; the motion estimation; as well as visualization of products (e.g. vector fields) in real-time, 24/7 over more than 6 months.
Our solution combines Python, C++/CUDA, MySQL and HTML+PHP.
Over the course of the experiment, more than 5 TB of raw data were collected and 250 billion wind vectors estimated.
The poster below describes some aspects of the experiment (click for full size, 7 MB).

Validation
A commercial doppler lidar, Streamline by Halophotonics, was used for comparisons with our measurements.
The doppler lidar was first used in vertical profiling mode (VAD) to compare time-series of 2-component wind vectors at a single location.
It was later operated in horizontal scanning mode, alongside the REAL, to compare the line-of-sight velocity component along the range (picture below).
 next to the REAL's beam steering unit (left).")
We found an excellent correlation between the doppler measures and our estimates for the 10-min mean wind vector for both algorithms[1][2].
References
- Wavelet-based optical flow for two-component wind field estimation from single aerosol lidar data, J. Atm. Oc. Tech., Vol. 32, 2015.
- Optimization of the cross-correlation algorithm for two-component wind field estimation from single aerosol lidar data and comparison with Doppler lidar, J. Atm. Oc. Tech., Vol. 33, 2016.
(more)
Swarm/Sand storm - Live image processing
Personal, 2013
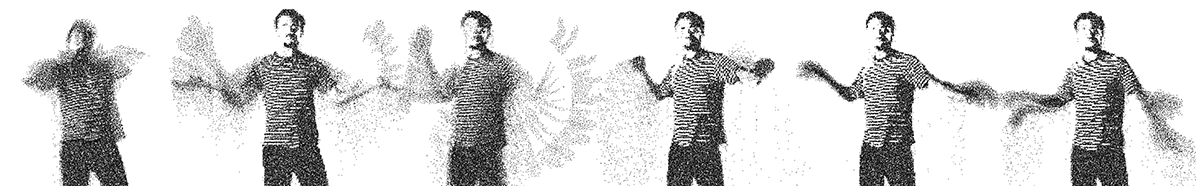
An experiment with Processing language/IDE. Actors are replaced in real-time by a swarm of particles subject to gravity. It is an invitation to play with motions and postures.
"Processing is an open source programming language and integrated development environment (IDE) built for the electronic arts, new media art, and visual design […]" (Wikipedia). Built upon Java, it enables to design somewhat advanced image processing tasks with live execution capabilities.
In this project, the input video data is read from the webcam (HD 720p). Actors are identified using a background subtraction approach, then replaced by clouds of dark particles subject to gravity. The visual is meant to evocate a mixed of swarming bees, sand whirling, and falling snow as one moves around. The total number of particles is limited (80,000 here) to allow for reasonable processing time and frame rate.
In the example below, the playback was sped up by 10% to compensate for the low input frame rate due to the simultaneous screen recording.
(more)
SAMPLE Winds I - wind estimation from SAMPLE lidar
Chico, CA, 07/2013 - 12/2013
This collaboration between the lidar team of CSU Chico and Spectral Sensor Solutions, LLC (S3) assessed the potential of the SAMPLE aerosol lidar for wind estimation.
The first step was to identify the specificities of the data collected by the SAMPLE lidar, and develop ad hoc pre-processing solutions. Then, a numerical framework was set up to integrate the Typhoon motion estimation software. Extensive testings and validations were performed on the dataset.
I supervised the whole study, and focused more specifically on the design of the pre-processing steps and the analysis of results. Modifications for the system were proposed in order to optimize the wind estimation capability. The outcome was very successful, both for S3 and the lidar group in Chico. S3 became the first commercial user of Typhoon.
(more)
PhD thesis: Wavelets and fluid motion estimation
Fluminance team, Inria Rennes, France, 10/2009 - 10/2012
My PhD thesis focused on the use of wavelet bases to represent fluid flows within the context of image-based fluid motion estimation.
This work was conducted under the supervision of Dr Etienne Mémin and Dr Patrick Héas at the Inria Rennes research institute. The Typhoon software is the reference implementation of the algorithm.
Abstract
This work falls within the general problematic of designing measurement tools adapted to the specificities of fluid flows. The development of digital imaging, combined with visualization techniques commonly employed in experimental fluid dynamics, enables to extract the apparent flow motion from image sequences, thanks to computer vision methods. The objective is to propose a novel "optical flow" algorithm dedicated to the multiscale motion estimation of fluid flows, using a wavelet representation of the unknown motion field. This wavelet formulation introduces a multiscale framework, conveniently adapted both to the optical flow estimation and to the representation of turbulent motion fields. It enables as well to design divergence-free bases, thereby respecting a constraint given by fluid dynamics. Several regularization schemes are proposed; the simplest consists in truncating the basis at fine scales, while the most complex builds high-order schemes from the connection coefficients of the wavelet basis. Proposed methods are evaluated on synthetic images in the first place, then on actual experimental images of characteristic fluid flows. Results are compared to those given by the usual "cross-correlations", highlighting the advantages and limits of the wavelet-based estimator.
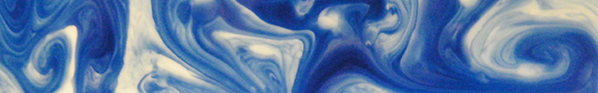
This video, prepared for my PhD defense, illustrates (i) the visualization of fluid motion, here using ink to reveal the flow structures; and (ii) results of the motion estimation, here displayed using light blue tracers in the second half of the movie.
References
- Wavelets and Fluid motion estimation, PhD thesis, 2012.
- Wavelets and Optical Flow Motion Estimation, Num. Math. The. Meth. App., 2013.
- Divergence-free Wavelets and High Order Regularization, Int. J. Comp. Vis., 2013.
(more)